The trouble with business models (Facebook buys Friendfeed)

…is that someone needs to make money out of them. It was inevitable at some point that Friendfeed would take a route that lead it towards mass adoption and away from the needs of the (rather small) community of researchers that have found a niche that works well for them. I had thought it more likely that Friendfeed would gradually move away from the aspects that researchers found attractive rather than being absorbed wholesale by a bigger player but then I don’t know much about how Silicon Valley really works. It appears that Friendfeed will continue in its current form as the two companies work out how they might integrate the functionality into Facebook but in the long term it seems unlikely that current service will survive. In a sense the sudden break may be a good thing because it forces some of the issues about providing this kind of research infrastructure out into the open in a way a gradual shift probably wouldn’t.

What is about Friendfeed that makes it particularly attractive to researchers? I think there are a couple of things, based more on hunches than hard data but in comparing with services like Twitter and Facebook there are a couple of things that standout.

  1. Conversations are about objects. At the core of the way Friendfeed works are digital objects, images, blog posts, quotes, thoughts, being pushed into a shared space. Most other services focus on the people and the connections between them. Friendfeed (at least the way I use it) is about the objects and the conversations around them.
  2. Conversation is threaded and aggregated. This is where Twitter loses out. It is almost impossible to track a specific conversation via Twitter unless you do so in real time. The threaded nature of FF makes it possible to track conversations days or months after they happen (as long as you can actually get into them)
  3. Excellent “person discovery” mechanisms. The core functionality of Friendfeed means that you discover people who “like” and comment on things that either you, or your friends like and comment on. Friendfeed remains one of the most successful services I know of at exploiting this “friend of a friend” effect in a useful way.
  4. The community. There is a specific community, with a strong information technology, information management, and bioinformatics/structural biology emphasis, that grew up and aggregated on Friendfeed. That community has immense value and it would be sad to lose it in any transition.

So what can be done? One option is to set back and wait to be absorbed into Facebook. This seems unlikely to be either feasible or popular. Many people in the FF research community don’t want this for reasons ranging from concerns about privacy, through the fundamentals of how Facebook works, to just not wanting to mix work and leisure contacts. All reasonable and all things I agree with.

We could build our own. Technically feasible but probably not financially. Lets assume a core group of say 1000 people (probably overoptimistic) each prepared to pay maybe $25 a year subscription as well as do some maintenance or coding work. That’s still only $25k, not enough to pay a single person to keep a service running let alone actually build something from scratch. Might the FF team make some of the codebase Open Source? Obviously not what they’re taking to Facebook but maybe an earlier version? Would help but there would still need to be either a higher subscription or many more subscribers to keep it running I suspect. Chalk one up for the importance of open source services though.

Reaggregating around other services and distributing the functionality would be feasible perhaps. A combination of Google Reader, Twitter, with services like Tumblr, Posterous, and StoryTlr perhaps? The community would be likely to diffuse but such a distributed approach could be more stable and less susceptible to exactly this kind of buy out. Nonetheless these are all commercial services that can easily dissappear. Google Wave has been suggested as a solution but I think has fundamental differences in design that make it at best a partial replacement. And it would still require a lot of work.

There is a huge opportunity for existing players in the Research web space to make a play here. NPG, Research Gate, and Seed, as well as other publishers or research funders and infrastructure providers (you know who you are) could fill this gap if they had the resource to build something. Friendfeed is far from perfect, the barrier to entry is quite high for most people, the different effective usage patterns are unclear for new users. Building something that really works for researchers is a big opportunity but it would still need a business model.

What is clear is that there is a signficant community of researchers now looking for somewhere to go. People with a real critical eye for the best services and functionality and people who may even be prepared to pay something towards it. And who will actively contribute to help guide design decisions and make it work. Build it right and we may just come.
Replication, reproduction, confirmation. What is the optimal mix?

Issues surrounding the relationship of Open Research and replication seems to be the meme of the week. Abhishek Tiwari provided notes on a debate describing concerns about how open research could damage replication and Sabine Hossenfelder explored the same issue in a blog post. The concern fundamentally is that by providing more of the details of our research we may actually be damaging the research effort by reducing the motivation to reproduce published findings or worse, as Sabine suggests, encouraging group think and a lack of creative questioning.

I have to admit that even at a naive level I find this argument peculiar. There is no question that in aiming to reproduce or confirm experimental findings it may be helpful to carry out that process in isolation, or with some portion of the available information withheld. This can obviously increase the quality and power of the confirmation, making it more general. Indeed the question of how and when to do this most effectively is very interesting and bears some thought. The optimization of these descisions in specific cases will be important part of improving research quality. What I find peculiar is the apparent belief in many quarters (but not necessarily Sabine who I think has a much more sophisticated view) that this optimization is best encouraged by not bothering to make information available. We can always choose not to access information if it is available but if it is not we cannot choose to look at it. Indeed to allow the optimization of the confirmation process it is crucial that we could have access to the information if we so decided.

But I think there is a deeper problem than the optimization issue. I think that the argument also involves two category errors. Firstly we need to distinguish between different types of confirmation. There is pure mechanical replication, perhaps just to improve statistical power or to re-use a technique for a different experiment. In this case you want as much detail as possible about how the original process was carried out because there is no point in changing the details. The whole point of the exercise is to keep things as similar as possible. I would suggest the use of the term “reproduction” to mean a slightly different case. Here the process or experiment “looks the same” and is intended to produce the same result but the details of the process are not tightly controlled. The purpose of the exercise is to determine how robust the result or output is to modified conditions. Here withholding, or not using, some information could be very useful. Finally there is the process of actually doing something quite different with the intention of testing an idea or a claim from a different direction with an entirely different experiment or process. I would refer to this as “confirmation”. The concerns of those arguing against providing detailed information lie primarily with confirmation, but the data and process sharing we are talking about relates more to replication and reproduction. The main efficiency gains lie in simply re-using shared process to get down a scientific path more rapidly rather than situations where the process itself is the subject of the scientific investigation.

The second category error is somewhat related in as much as the concerns around “group-think” refer to claims and ideas whereas the objects we are trying to encourage sharing when we talk about open research are more likely to be tools and data. Again, it seems peculiar to argue that the process of thinking independently about research claims is aided by reducing  the amount of data available. There is a more subtle argument that Sabine is making and possibly Harry Collins would make a similar one, that the expression of tools and data may be inseparable from the ideas that drove their creation and collection. I would still argue however that it is better to actively choose to omit information from creative or critical thinking rather than be forced to work in the dark. I agree that we may need to think carefully about how we can effectively do this and I think that would be an interesting discussion to have with people like Harry.

But the argument that we shouldn’t share because it makes life “too easy” seems dangerous to me. Taking that argument to its extreme we should remove the methods section from papers altogether. In many cases it feels like we already have and I have to say that in day to day research that certainly doesn’t feel helpful.

Sabine also makes a good point, that Michael Nielsen also has from time to time, that these discussions are very focussed on experimental and specifically hypothesis driven research. It bears some thinking about but I don’t really know enough about theoretical research to have anything useful to add. But it is the reason that some of the language in this post may seem a bit tortured.

Watching the future…student demos at University of Toronto

On Wednesday morning I had the distinct pleasure of seeing a group of students in the Computer Science department at the University of Toronto giving demos of tools and software that they have been developing over the past few months. The demos themselves were of a consistently high standard throughout, in many ways more interesting and more real than some of the demos that I saw the previous night at the “professional” DemoCamp 21. Some, and I emphasise only some, of the demos were less slick and polished but in every case the students had a firm grasp of what they had done and why, and were ready to answer criticisms or explain design choices succinctly and credibly. The interfaces and presentation of the software was consistently not just good, but beautiful to look at, and the projects generated real running code that solved real and immediate problems. Steve Easterbrook has given a run down of all the demos on his blog but here I wanted to pick out three that really spoke to problems that I  have experienced myself.

I mentioned Brent Mombourquette‘s work on Breadcrumbs yesterday (details of the development of all of these demos is available on the student’s linked blogs). John Pipitone demonstrated this Firefox extension that tracks your browsing history and then presents it as a graph. This appealed to me immensely for a wide range of reasons: firstly that I am very interested in trying to capture, visualise, and understand the relationships between online digital objects. The graphs displayed by breadcrumbs immediately reminded me of visualisations of thought processes with branches, starting points, and the return to central nodes all being clear. In the limited time for questions the applications in improving and enabling search, recording and sharing collections of information, and even in identifying when thinking has got into a rut and needs a swift kick were all covered. The graphs can be published from the browser and the possibilities that sharing and analysing these present are still popping up with new ideas in my head several days later. In common with the rest of the demos my immediate response was, “I want to play with that now!”

The second demo that really caught my attention was a MediaWiki extension called MyeLink written by Maria Yancheva that aimed to find similar pages on a wiki. This was particularly aimed at researchers keeping a record of their work and wanting to understand how one page, perhaps describing an experiment that didn’t work, was different to a similar page, describing and experiment that did. The extension identifies similar pages in the wiki based on either structure (based primarily on headings I think) or in the text used. Maria demonstrated comparing pages as well as faceted browsing of the structure of the pages in line with the extension. The potential here for helping people manage their existing materials is huge. Perhaps more exciting, particularly in the context of yesterday’s post about writing up stories, is the potential to assist people with preparing summaries of their work. It is possible to imagine the extension first recognising that you are writing a summary based on the structure, and then recognising that in previous summaries you’ve pulled text from a different specific class of pages, all the while helping you to maintain a consitent and clear structure.

The last demo I want to mention was from Samar Sabie of a second MediaWiki extension called VizGraph. Anyone who has used a MediaWiki or a similar framework for recording research knows the problem. Generating tables, let alone graphs, sucks big time. You have your data in a CSV or Excel file and you need to transcribe, by hand, into a fairly incomprehensible, but more importantly badly fault intolerant, syntax to generate any sort of sensible visualisation. What you want, and what VizGraph supplies is a simple Wizard that allows you to upload your data file (CSV or Excel naturally) steps you through a few simple questions that are familiar from the Excel chart wizards and then drops that back into the page as a structured text data that is then rendered via the GoogleChart API. Once it is there you can, if you wish, edit the structured markup to tweak the graph.

Again, this was a great example of just solving the problem for the average user, fitting within their existing workflow and making it happen. But that wasn’t the best bit. The best bit was almost a throwaway comment as we were taken through the Wizard; “and check this box if you want to enable people to download the data directly from a link on the chart…”. I was sitting next to Jon Udell and we both spontaneously did a big thumbs up and just grinned at each other. It was a wonderful example of “just getting it”. Understanding the flow, the need to enable data to be passed from place to place, while at the same time make the user experience comfortable and seamless.

I am sceptical about the rise of a mass “Google Generation” of tech savvy and sophisticated users of web based tools and computation. But what Wednesday’s demos showed to me in no uncertain terms was that when you provide a smart group of people, who grew up with the assumption that the web functions properly, with tools and expertise to effectively manipulate and compute on the web then amazing things happen.  That these students make assumptions of how things should work, and most importantly that they should, that editing and sharing should be enabled by default, and that user experience needs to be good as a basic assumptionwas brought home by a conversation we had later in the day at the Science 2.0 symposium.

The question was  “what does Science 2.0 mean anyway?”. A question that is usually answered by reference to Web 2.0 and collaborative web based tools. Steve Easterbrooks‘s opening gambit in response was “well you know what Web 2.0 is don’t you?” an this was met with slightly glazed stares. We realized that, at least to a certain extent, for these students there is no Web 2.0. It’s just the way that the web, and indeed the rest of the world, works. Give people with these assumptions the tools to make things and amazing stuff happens. Arguably, as Jon Udell suggested later in the day, we are failing a generation by not building this into a general education. On the other hand I think it pretty clear that these students at least are going to have a big advantage in making their way in the world of the future.

Apparently screencasts for the demoed tools will be available over the next few weeks and I will try and post links here as they come up. Many thanks to Greg Wilson for inviting me to Toronto and giving me the opportunity to be at this session and the others this week.

Sci – Bar – Foo etc. Part III – Google Wave Session at SciFoo

Google Wave has got an awful lot of people quite excited. And others are more sceptical. A lot of SciFoo attendees were therefore very excited to be able to get an account on the developer sandbox as part of the weekend. At the opening plenary Stephanie Hannon gave a demo of Wave and, although there were numerous things that didn’t work live, that was enough to get more people interested. On the Saturday morning I organized a session to discuss what we might do and also to provide an opportunity for people to talk about technical issues. Two members of the wave team came along and kindly offered their expertise, receiving a somewhat intense grilling as thanks for their efforts.

I think it is now reasonably clear that there are two short to medium term applications for Wave in the research process. The first is the collaborative authoring of documents and the conversations around those. The second is the use of wave as a recording and analysis platform. Both types of functionality were discussed with many ideas for both. Martin Fenner has also written up some initial impressions.

Naturally we recorded the session in Wave and even as I type, over a week later, there is a conversation going in real time about the details of taking things forward. There are many things to get used to, not leastwhen it is polite to delete other people’s comments and clean them up, but the potential (and the weaknesses and areas for development) are becoming clear.

I’ve pasted our functionality brainstorm at the bottom to give people an idea of what we talked about but the discussion was very wide ranging. Functionality divided into a few categories. Firstly Robots for bringing scientific objects, chemical structures, DNA sequences, biomolecular structures, videos, and images into the wave in a functional form with links back to a canonical URI for the object. In its simplest form this might just provide a link back to a database. So typing “chem:benzene” or “pdb:1ecr” would trigger a robot to insert a link back to the database entry. More complex robots could insert an image of the chemical (or protein structure) or perhaps rdf or microformats that provide a more detailed description of the molecule.

Taking this one step further we also explored the idea of pulling data or status information from larboratory instruments to create a “laboratory dashboard” and perhaps controlling them. This discussion was helpful in getting a feel for what Wave can and can’t do as well as how different functionalities are best implemented. A robot can be built to populate a wave with information or data from laboratory instruments and such a robot could also pass information from the wave back to the instrument in principle. However both of these will still require some form of client running on the instrument side that is capable of talking to the robot web service. So the actual problem of interfacing with the instrument will remain. We can hope that instrument manufacturers might think of writing out nice simple XML log files at some point but in the meantime this is likely to involve hacking things together. If you can manage this then a Gadget will provide a nice way of providing a visual dashboard type interface to keep you updated as to what is happening.

Sharing data analysis is something of significant interest to me and the fact that there is already a robot (called Monty) that will intepret Python is a very interesting starting point for exploring this. There is some basic graphing functionality (Graphy naturally). For me this is where some of the most exciting potential lies; not just sharing printouts or the results of data analysis procedures but the details of the data and a live representation of the process that lead to the results. Expect much more from me on this in the future as we start to take it forward.

The final area of discussion, and the one we probably spent the most time on, was looking at Wave in the authoring and publishing process. Formatting of papers, sharing of live diagrams and charts, automated reference searching and formatting, as well as submission processes, both to journals and to other repositories, and even the running of peer review process were all discussed. This is the area where the most obvious and rapid gains can be made. In a very real sense Wave was designed to remove the classic problem of sending around manuscript versions with multiple figure and data files by email so you would expect it to solve a number of the obvious problems. The interesting thing in my view will be to try it out in anger.

Which was where we finished the session. I proposed the idea of writing a paper, in Wave, about the development and application of tools needed to author papers in Wave. As well as the technical side, such a paper would discuss the user experience, and any of the social issues that arise out of such a live collaborative authoring experience. If it were possible to run an actual peer review process in Wave that would also be very cool however this might not be feasible given existing journal systems. If not we will run a “mock” peer review process and look at how that works. If you are interested in being involved, drop a note in the comments, or join the Google Group that has been set up for discussions (or if you have a developer sandbox account and want access to the Wave drop me a line).

There will be lots of details to work through but the overall feel of the session for me was very exciting and very positive. There will clearly be technical and logistical barriers to be overcome. Not least that a a significant quantity of legacy toolingmay not be a good fit for Wave. Some architectural thinking on how to most effectively re-use existing code may be required. But overall the problem seems to be where to start on the large set of interesting possibilities. And that seems a good place to be with any new technology.

Continue reading “Sci – Bar – Foo etc. Part III – Google Wave Session at SciFoo”

Science 2.0 in Toronto – MaRS Centre 29 July

Greg Wilson has put together an amazing set of speakers for a symposium entitled – “Science 2.0: What every scientist needs to know about how the web is changing the way they work“. It is very exciting for me to be sharing a platform with Michael Nielsen, Victoria Stodden, Titus Brown, David Rich and Jon Udell. The full details are available at the link. The event is free but you need to register in advance.

  • Titus Brown: Choosing Infrastructure and Testing Tools for Scientific Software Projects
  • Cameron Neylon: A Web Native Research Record: Applying the Best of the Web to the Lab Notebook
  • Michael Nielsen: Doing Science in the Open: How Online Tools are Changing Scientific Discovery
  • David Rich: Using “Desktop” Languages for Big Problems
  • Victoria Stodden: How Computational Science is Changing the Scientific Method
  • Jon Udell: Collaborative Curation of Public Events

Sci – Bar – Foo etc. Part I – SciBarCamp Palo Alto

Last week I was lucky enough to attend both SciBarCamp Palo Alto and SciFoo; both for the second time. In the next few posts I will give a brief survey of the highlights of both, kicking off with SciBarCamp. I will follow up with more detail on some of the main things to come out of these meetings over the next week or so.

SciBarCamp followed on from last year’s BioBarCamp and was organized by Jamie McQuay, John Cumbers, Chris Patil, and Shirley Wu. It was held at the Institute for the Future at Palo Alto which is a great space for a small multisession meeting for about 70 people.

A number of people from last year’s camp came but there was a good infusion of new people as well with a strong element of astronomy and astonautics as well as a significant number of people with one sort of media experience or another who were interested in science providing a different kind of perspective.

After introductions and a first past at the session planning the meeting was kicked off by a keynote from Sean Mooney on web tools for research. The following morning kicked off for me with a session lead by Chris Patil on Open Source text books with an interesting discussion on how to motivate people to develop content. I particularly liked the notion of several weeks in a pleasant place drinking cocktails hammering out the details of the content. Joanna Scott and Andy Lang gave a session on the use of Second Life for visualization and scientific meetings. You can see Andy’s slides at slideshare.

Tantek Celik gave a session on how to make data available from a technical perspective with a focus on microformats as a means of marking up elements. His list of five key points for publishing data on the web make a good checklist. Unsurprisingly, being a key player at microformats.org he played up microformats. There was a pretty good discussion, that continued through some other sessions, on the relative value of microformats versus XML or rdf. Tantik was dismissive which I would agree with for much of the consumer web, but I would argue that the place where semantic web tools are starting to make a difference is the sciences and the microformats, at least in their controlled vocabulary form, are unlikely to deliver. In any case a discussion worth having, and continuing.

An excellent Indian lunch (although I would take issue with John’s assertion that it was the best outside of Karachi, we don’t do too badly here in the UK), was followed by a session from Alicia Grubb on Scooping, Patents, and Open Science. I tried to keep my mouth shut and listen but pretty much failed. Alicia is also running a very interesting project looking at researcher’s attitudes towards reproducibility and openness. Do go and fill out her survey. After this (or actually maybe it was before – it’s becoming a blur) Pete Binfield ran a session on how (or whether) academic publishers might survive the next five years. This turned into a discussion more about curation and archival than anything else although there was a lengthy discussion of business models as well.

Finally myself, Jason Hoyt, and Duncan Hull did a tag team effort entitled “Bending the Internet to Scientists (not the other way around)“. I re-used the first part of the slides from my NESTA Crucible talk to raise the question of how we maximise the efficiency of the public investment in research. Jason talked about why scientists don’t use the web, using Mendeley as an example of trying to fit the web to scientists’ needs rather than the other way around, and Duncan closed up with discussion of online researcher identities. Again this kicked off an interesting discussion.

Video of several sessions is available thanks to Naomi Most. The friendfeed room is naturally chock full of goodness and there is always a Twitter search for #sbcPA. I missed several sessions which sounded really interesting, which is the sign of a great BarCamp. It was great to catch up with old friends, finally meet several people who I know well from online, as well as meet a whole new bunch of cool people. As Jamie McQuay said in response to Kirsten Sanford, it’s the attendees that make these conferences work. Congrats to the organizers for another great meeting. Here’s looking forward to next year.

Some slides for granting permissions (or not) in presentations

A couple of weeks ago there was a significant fracas over Daniel MacArthur‘s tweeting from a Cold Spring Harbour Laboratory meeting.  This was followed in pretty quick succession by an article in Nature discussing the problems that could be caused when the details of presentations no longer stop at the walls of the conference room and all of these led to a discussion (see also friendfeed discussions) about how to make it clear whether you are happy or not with your presentation being photographed, videoed, or live blogged. A couple of suggestions were made for logos or icons that might be used.

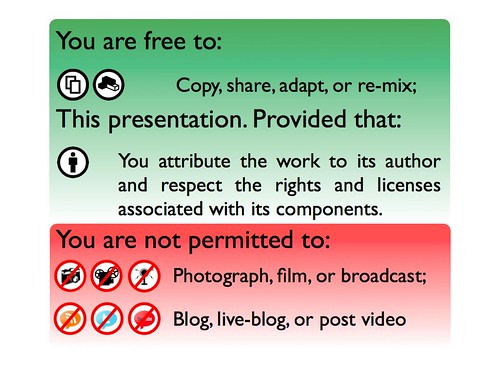
I thought it might be helpful rather than a single logo to have a panel that allows the presenter to permit some activities but not others and put together a couple of mockups.

Permission to do whatever with presentationPermission to do less with presentation

I’ve also uploaded a PowerPoint file with the two of these as slides to Slideshare which should enable you to download, modify, and extract the images as you wish. In both cases they are listed as having CC-BY licences but feel free to use them without any attribution to me.

In some of the Friendfeed conversations there are some good comments about how best to represent and suggestions on possible improvements. In particular Anders Norgaard suggests a slightly more friendly “please don’t” rather than my “do not”. Entirely up to you, but I just wanted to get these out. At the moment these are really just to prompt discussion but if you find them useful then please re-post modified versions for others to use.

[Ed. The social media icons are from Chris Ross and are by default under a GPL license. I have a request in to make them available to the Public Domain or as CC-BY at least for re-use. And yes I should have picked this up before.]

Conferences as Spam? Liveblogging science hits the mainstream

I am probably supposed to be writing up some weighty blog post on some issue of importance but this is much more fun. Last year’s International Conference on Intelligent Systems for Molecular Biology (ISMB) kicked off one of the first major live blogging exercises in a mainstream biology conference. It was so successful that the main instigators were invited to write up the exercise and the conference in a paper in PLoS Comp Biol. This year, the conference organizers, with significant work from Michael Kuhn and many others, have set up a Friendfeed room and publicised this from the off, with the idea of supporting a more “official”, or at least coordinated process of disseminating the conference to the wider world. Many have been waiting in anticipation for the live blogging to start due to logistical or financial difficulties in attending in person.

However, there were also concerns. Many of the original ring leaders were not attending. With the usual suspects confined to their home computers would the general populace take up the challenge and provide the rich feed of information the world was craving? Things started well, then moved on rapidly as the room filled up. But the question as to whether it was sustainable was answered pretty effectively when the Friendfeed room went suddenly quiet. Fear gripped the microbloggers. Could the conference go on? Gradually the technorati figured out they could still post by VPNing to somewhere else. Friendfeed was blocking the IP corresponding to the conference wireless network. So much traffic was being generated it looked like spam! This has now been corrected, and normal service resumed, but in a funny and disturbing kind of way it seems to me like a watershed. There were enough people, and certainly not just the usual suspects, live blogging a scientific conference that the traffic looked like spam. Ladies and Gentleman. Welcome to the mainstream.