Tweeting the lab

Free twitter badge
Image via Wikipedia

I’ve been interested for some time in capturing information and the context in which that information is created in the lab. The question of how to build an efficient and useable laboratory recording system is fundamentally one of how much information is necessary to record and how much of that can be recorded while bothering the researcher themselves as little as possible.

The Beyond the PDF mailing list has, since the meeting a few weeks ago, been partly focused on attempts to analyse human written text and to annotate these as structured assertions, or nanopublications. This is also the approach that many Electronic Lab Notebook systems attempt to take, capturing an electronic version of the paper notebook and in some cases trying to capture all the information in it in a structured form. I can’t help but feel that, while this is important, it’s almost precisely backwards. By definition any summary of a written text will throw away information, the only question is how much. Rather than trying to capture arbitrary and complex assertions in written text, it seems better to me to ask what simple vocabulary can be provided that can express enough of what people want to say to be useful.

In classic 80/20 style we ask what is useful enough to interest researchers, how much would we lose, and what would that be? This neatly sidesteps the questions of truth (though not of likelihood) and context that are the real challenge of structuring human authored text via annotation because the limited vocabulary and the collection of structured statements made provides an explicit context.

This kind of approach turns out to work quite well in the lab. In our blog based notebook we use a one item-one post approach where every research artifact gets its own URL. Both the verbs, the procedures, and the nouns, the data and materials, all have a unique identifier. The relationships between verbs and nouns is provided by simple links. Thus the structured vocabulary of the lab notebook is [Material] was input to [Process] which generated [Data] (where Material and Data can be interchanged depending on the process).  This is not so much 80/20 as 30/70 but even in this very basic form in can be quite useful. Along with records of who did something and when, and some basic tagging this actually makes a quite an effective lab notebook system.

The question is, how can we move beyond this to create a record which is richer enough to provide a real step up, but doesn’t bother the user any more than is necessary and justified by the extra functionality that they’re getting. In fact, ideally we’d capture a richer and more useful record while bothering the user less. A part of the solution lies in the work that Jeremy Frey’s group have done with blogging instruments. By having an instrument create a record of it’s state, inputs and outputs, the user is freed to focus on what their doing, and only needs to link into that record when they start to do their analysis.

Another route is the approach that Peter Murray-Rust’s group are exploring with interactive lab equipment, particularly a fume cupboard that can record spoken instructions and comments and track where objects are, monitoring an entire process in detail. The challenge in this approach lies in translating that information into something that is easy to use downstream. Audio and video remain difficult to search and worth with. Speech recognition isn’t great for formatting and clear presentation.

In the spirit of a limited vocabulary another approach is to use a lightweight infrastructure to record short comments, either structured, or free text. A bakery in London has a switch on its wall which can be turned to one of a small number of baked good as a batch goes into the oven. This is connected to a very basic twitter client then tells the world that there are fresh baked baguettes coming in about twenty minutes. Because this output data is structured it would in principle be possible to track the different baking times and preferences for muffins vs doughnuts over the day and over the year.

The lab is slightly more complex than a bakery. Different processes would take different inputs. Our hypothetical structured vocabulary would need to enable the construction of sentences with subjects, predicates, and objects, but as we’ve learnt with the lab notebook, even the simple predicate “is input to”, “is output of” can be very useful. “I am doing X” where X is one of a relatively small set of options provides real time bounds on when important events happened. A little more sophistication could go a long way. A very simple twitter client that provided a relatively small range of structured statements could be very useful. These statements could be processed downstream into a more directly useable record.

Last week I recorded the steps that I carried out in the lab via the hashtag #tweetthelab. These free text tweets make a serviceable, if not perfect, record of the days work. What is missing is a URI for each sample and output data file, and links between the inputs, the processes, and the outputs. But this wouldn’t be too hard to generate, particularly if instruments themselves were actually blogging or tweeting its outputs. A simple client on a tablet, phone, or locally placed computer would make it easy to both capture and to structure the lab record. There is still a need for free text comments and any structured description will not be able to capture everything but the potential for capturing a lot of the detail of what is happening in a lab, as it happens, is significant. And it’s the detail that often isn’t recorded terribly well, the little bits and pieces of exactly when something was done, what did the balance really read, which particular bottle of chemical was picked up.

Twitter is often derided as trivial, as lowering the barrier to shouting banal fragments to the world, but in the lab we need tools that will help us collect, aggregate and structure exactly those banal pieces so that we have them when we need them. Add a little bit of structure to that, but not too much, and we could have a winner. Starting from human discourse always seemed too hard for me, but starting with identifying the simplest things we can say that are also useful to the scientist on the ground seems like a viable route forward.
Enhanced by Zemanta

A little bit of federated Open Notebook Science

Girl Reading a Letter at an Open Window
Image via Wikipedia

Jean-Claude Bradley is the master when it comes to organising collaborations around diverse sets of online tools. The UsefulChem and Open Notebook Science Challenge projects both revolved around the use of wikis, blogs, GoogleDocs, video, ChemSpider and whatever tools are appropriate for the job at hand. This is something that has grown up over time but is at least partially formally organised. At some level the tools that get used are the ones Jean-Claude decides will be used and it is in part his uncompromising attitude to how the project works (if you want to be involved you interact on the project’s terms) that makes this work effectively.

At the other end of the spectrum is the small scale, perhaps random collaboration that springs up online, generates some data and continues (or not) towards something a little more organised. By definition such “projectlets” will be distributed across multiple services, perhaps uncoordinated, and certainly opportunistic. Just such a project has popped up over the past week or so and I wanted to document it here.

I have for some time been very interested in the potential of visualising my online lab notebook as a graph. The way I organise the notebook is such that it, at least in a sense, automatically generates linked data and for me this is an important part of its potential power as an approach. I often use a very old graph visualisation in talks I give out the notebook as a way of trying to indicate the potential which I wrote about previously, but we’ve not really taken it any further than that.

A week or so ago, Tony Hirst (@psychemedia) left a comment on a blog post which sparked a conversation about feeds and their use for generating useful information. I pointed Tony at the feeds from my lab notebook but didn’t take it any further than that. Following this he posted a series of graph visualisations of the connections between people tweeting at a set of conferences and then the penny dropped for me…sparking this conversation on twitter.

@psychemedia You asked about data to visualise. I should have thought about our lab notebook internal links! What formats are useful? [link]

@CameronNeylon if the links are easily scrapeable, it’s easy enough to plot the graph eg http://blog.ouseful.info/2010/08/30/the-structure-of-ouseful-info/ [link]

@psychemedia Wouldn’t be too hard to scrape (http://biolab.isis.rl.ac.uk/camerons_labblog) but could possibly get as rdf or xml if it helps? [link]

@CameronNeylon structured format would be helpful… [link]

At this point the only part of the whole process that isn’t publicly available takes place as I send an email to find out how to get an XML download of my blog and then report back  via Twitter.

@psychemedia Ok. XML dump at http://biolab.isis.rl.ac.uk/camerons_labblog/index.xml but I will try to hack some Python together to pull the right links out [link]

Tony suggests I pull out the date and I respond that I will try to get the relevant information into some sort of JSON format, and I’ll try to do that over the weekend. Friday afternoons being what they are and Python being what is I actually manage to do this much quicker than I expect and so I tweet that I’ve made the formatted data, raw data, and script publicly available via DropBox. Of course this is only possible because Tony tweeted the link above to his own blog describing how to pull out and format data for Gephi and it was easy for me to adapt his code to my own needs, an open source win if there ever was one.

Despite the fact that Tony took the time out to put the kettle on and have dinner and I went to a rehearsal by the time I went to bed on Friday night Tony had improved the script and made it available (with revisions) via a Gist, identified some problems with the data, and posted an initial visualisation. On Saturday morning I transfer Tony’s alterations into my own code, set up a local Git repository, push to a new Github repository, run the script over the XML dump as is (results pushed to Github). I then “fix” the raw data by manually removing the result of a SQL insertion attack – note that because I commit and push to the remote repository I get data versioning for free – this “fixing” is transparent and recorded. Then I re-run the script, pushing again to Github. I’ve just now updated the script and committed once more following further suggestions from Tony.

So over a couple of days we used Twitter for communication, DropBox, GitHub, Gists, and Flickr for sharing data and code, and the whole process was carried out publicly. I wouldn’t have even thought to ask Tony about this if he hadn’t  been publicly posting his visualisations (indeed I remember but can’t find an ironic tweet from Tony a few weeks back about it would be clearly much better to publish in a journal in 18 months time when no-one could even remember what the conference he was analysing was about…).

So another win for open approaches. Again, something small, something relatively simple, but something that came together because people were easily connected in a public space and were routinely sharing research outputs, something that by default spread into the way we conducted the project. It never occurred to me at the time, I was just reaching for the easiest tool at each stage, but at every stage every aspect of this was carried out in the open. It was just the easiest and most effective way to do it.

Enhanced by Zemanta

Reflections on Science 2.0 from a distance – Part II

This is the second of two posts discussing the talk I gave at the Science 2.0 Symposium organized by Greg Wilson in Toronto in July. As I described in the last post Jon Udell pulled out the two key points from my talk and tweeted them. The first suggested some ideas about what the limiting unit of science, or rather science communication, might be. The second takes me in to rather more controversial areas:

@cameronneylon uses tags to classify records in a bio lab wiki. When emergent ontology doesn’t match the standard, it’s useful info. #osci20

It may surprise many to know that I am a great believer in ontologies and controlled vocabularies. This is because I am a great believer in effectively communicating science and without agreed language effective communication isn’t possible. Where I differ with many is that assumption that because an ontology exists it provides the best means of recording my research. This is borne out of my experiences trying to figure out how to apply existing data models and structured vocabularies to my own research work. Very often the fit isn’t very good, and more seriously, it is rarely clear why or how to go about adapting or choosing the right ontology or vocabulary.

What I was talking about in Toronto was the use of key-value pairs within the Chemtools LaBLog system and the way we use them in templates. To re-cap briefly the templates were initially developed so that users can avoid having to manually mark up posts, particularly ones with tables, for common procedures. The fact that we were using a one item-one post system meant that we knew that important inputs into that table would have their own post and that the entry in the table could link to that post. This in turn meant that we could provide the user of a template with a drop down menu populated with post titles. We filter those on the basis of tags, in the form of key-value pairs, so as to provide the right set of possible items to the user. This creates a remarkably flexible, user-driven, system that has a strong positive reinforcement cycle. To make the templates work well, and to make your life easier you need to have the metadata properly recorded for research objects, but in turn you can create templates for your objects that make sure that the metadata is recorded correctly.

The effectiveness of the templates clearly depends very strongly on the organization of the metadata. The more the pattern of organization maps on to the realities of how substances and data files are used in the local research process, and the more the templates reflect the details of that process the more effective they are. We went though a number of cycles of template and metadata re-organization. We would re-organize, thinking we had things settled and then we would come across another instance of a template breaking, or not working effectively. The motivation to re-organize was to make the templates work well, and save effort. The system aided us in this by allowing us to make organizational changes without breaking any of the previous schemes.

Through repeated cycles of modification and adaption we identified an organizational scheme that worked effectively. Essentially this is a scheme that categorizes objects based on what they can be used for. A sample may be in the material form of a solution, but it may also be some form of DNA.  Some procedures can usefully be applied to any solution, some are only usefully applied to DNA. If it is a form of DNA then we can ask whether it is a specific form, such as an oligonucleotide, that can be used in specific types of procedure, such as a PCR. So we ended up with a classification of DNA types based on what they might be used for (any DNA can be a PCR templates, only a relatively short single stranded DNA can be used as a – conventional – PCR primer). However in my work I also had to allow for the fact that something that was DNA might also be protein; I have done work on protein-DNA conjugates and I might want to run these on both a protein gel and a DNA gel.

We had, in fact, built our own, small scale laboratory ontology that maps onto what we actually do in our laboratory. There was little or no design that went into this, only thinking of how to make our templates work. What was interesting was the process of then mapping our terms and metadata onto designed vocabularies. The example I used in the talk was the Sequence Ontology terms relating to categories of DNA. We could map the SO term plasmid on to our key value pair DNA:plasmid, meaning a double stranded circular DNA capable in principle of transforming bacteria. SO:ss_oligo maps onto DNA:oligonucleotide (kind of, I’ve just noticed that synthetic oligo is another term in SO).

But we ran into problems with our type DNA:double_stranded_linear. In SO there is more than one term, including restriction fragments and PCR products. This distinction was not useful to us. In fact it would create a problem. For our purposes restriction fragments and PCR products were equivalent in terms of what we could do with them. The distinction the SO makes is in where they come from, not what they can do. Our schema is driven by what we can do with them. Where they came from and how they were generated is also implicit in our schema but it is separated from what an object can be used for.

There is another distinction here. The drop down menus in our templates do not have an “or” logic in the current implementation. This drives us to classify the possible use of objects in as general a way as possible. We might wish to distinguish between “flat ended” linear double stranded DNA (most PCR products) and “sticky ended” or overhanging linear ds DNA (many restriction fragments) but we are currently obliged to have at least one key value pair places these together as many standard procedures can be applied to both. In ontology construction there is a desire to describe as much detail as possible. Our framework drives us towards being as general as possible. Both approaches have their uses and neither is correct. They are built for different purposes.

The bottom line is that for a structured vocabulary to be useful and used it has to map well onto two things. The processes that the user is operating and the inputs and outputs of those processes. That is it must match the mental model of the user. Secondly it must map well onto the tools that the user has to work with. Most existing biological ontologies do not map well onto our LaBLog system, although we can usually map to them relatively easy for specific purposes in a post-hoc fashion. However I think our system is mapped quite well by some upper ontologies.

I’m currently very intrigued by an idea that I heard from Allyson Lister, which matches well onto some other work I’ve recently heard about that involves “just in time” and “per-use” data integration. It also maps onto the argument I made in my recent paper that we need to separate the issues of capturing research from those involved in describing and communicating research. The idea was that for any given document or piece of work, rather than trying to fit it into a detailed existing ontology you build a single-use local ontology based on what is happening in this specific case based on a more general ontology, perhaps OBO, perhaps something even more general. Then this local description can be mapped onto more widely used and more detailed ontologies for specific purposes.

At the end of the day the key is effective communication. We don’t all speak the same language and we’re not going to. But if we had the tools to help us capture our research in an appropriate local dialect in a way that makes it easy for us, and others, to translate into whatever lingua franca is best for a given purpose, then we will make progress.

Capturing the record of research process – Part I

When it comes to getting data up on the web, I am actually a great optimist. I think things are moving in the right direction and with high profile people like Tim Berners-Lee making the case, the with meme of “Linked Data” spreading, and a steadily improving set of tools and interfaces that make all the complexities of RDF, OWL, OAI-ORE, and other standards disappear for the average user, there is a real sense that this might come together. It will take some time; certainly years, possibly a decade, but we are well along the road.

I am less sanguine about our ability to record the processes that lead to that data or the process by which raw data is turned into information. Process remains a real recording problem. Part of the problem for this is just that scientists are rather poor at recording process in most cases, often assuming that the data file generated is enough. Part of the problem is the lack of tools to do the recording effectively, the reason why we are interested in developing electronic laboratory recording systems.

Part of it is that the people who have been most effective at getting data onto the web tend to be informaticians rather than experimentalists. This has lead in a number of cases to very sophisticated systems for describing data, and for describing experiments, that are a bit hazy about what it is they are actually describing. I mentioned this when I talked about Peter Murray-Rust and Egon Willighagen’s efforts at putting at UsefulChem experiments into Chemistry Markup Language. While we could describe a set of results we got awfully confused because we weren’t sure whether we were describing a specific experiment, the average of several experiments, or a description of what we thought was happening in the experiments. This is not restricted to CML. Similar problems arise with many of the MIBBI guidelines where the process of generating the data gets wrapped up with the data file. None of these things are bad, it is just that we may need some extra thought about distinguishing between classes and instances.

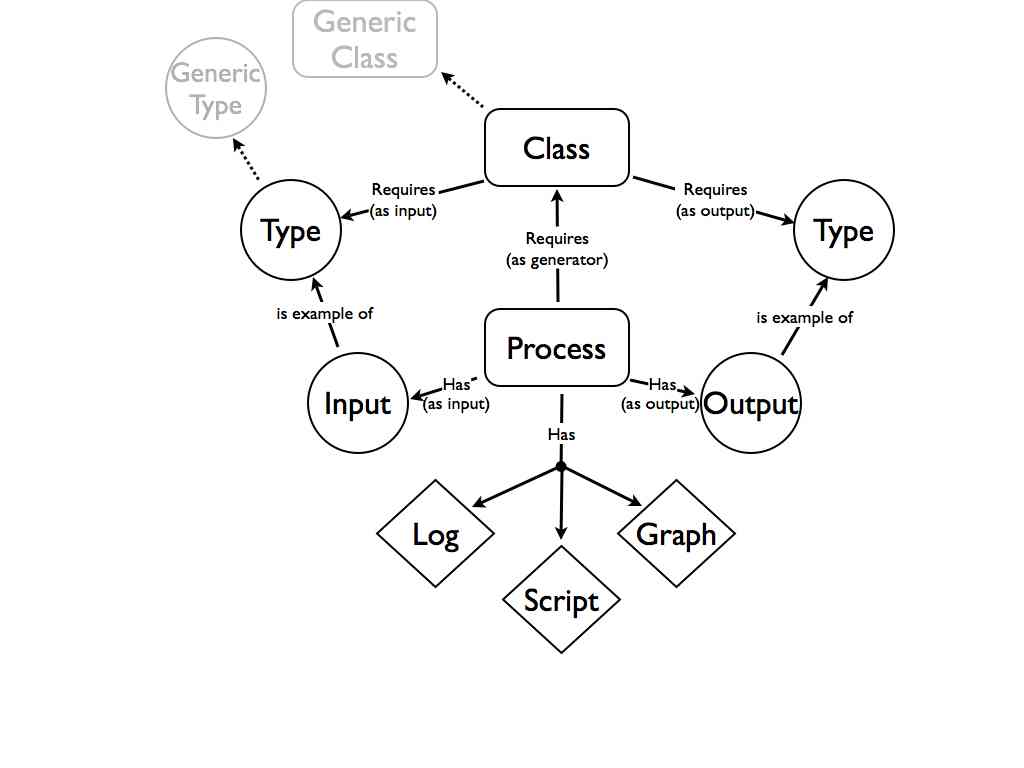
In the world of linked data Process can be thought of either as a link between objects, or as an object in its own right. The distinction is important. A link between, say, a material and data files, points to a vocabulary entry (e.g. PCR, HPLC analysis, NMR analysis). That is the link creates a pointer to the class of a process, not to a specific example of carrying out that process. If the process is an object in its own right then it refers reasonably clearly to a specific instance of that process (it links this material, to that data file, on this date) but it breaks the links between the inputs and outputs. While RDF can handle this kind of break by following the links though it creates the risk of a rapidly expanding vocabulary to hold all the potential relationships to different processes.There are other problems with this view. The object that represents the process. Is it a a log of what happened? Or is it the instructions to transform inputs into outputs? Both are important for reproducibility but they may be quite different things. They may even in some cases be incompatible if for some reason the specific experiment went off piste (power cut, technical issues, or simply something that wasn’t recorded at the time, but turned out to be important later).

The problem is we need to think clearly about what it is we mean when we point at a process. Is it merely a nexus of connections? Things coming out, things going in. Is it the log of what happened? Or is it the set of instructions that lets us convert these inputs into those outputs. People who have thought about this from a vocabulary of informatics perspective tend to worry mostly about categorization. Once you’ve figure out what the name of this process is and where it falls in the heirachy you are done. People who work on minimal description frameworks start from the presumption that we understand what the process is (a microarray experiment, electrophoresis etc). Everything within that is then internally consistent but it is challenging in many cases to link out into other descriptions of other processes. Again the distinction between what was planned to be done, and what was actually done, what instructions you would give to someone else if they wanted to do it, and how you would do it yourself if you did it again, have a tendency to be somewhat muddled.

Basically process is complicated, and multifaceted, with different requirements depending on your perspective. The description of a process will be made up of several different objects. There is a collection of inputs and a collection of outputs. There is a pointer to a classification, which may in itself place requirements on the process. The specific example will inherit requirements from the abstract class (any PCR has two primers, a specific PCR has two specific primers). Finally we need the log of what happened, as well as the “script” that would enable you to do it again. On top of this for a complex process you would need a clear machine-readable explanation of how everything is related. Ideally a set of RDF statements that explain what the role of everything is, and links the process into the wider web of data and things. Essentially the RDF graph of the process that you would use in an idealized machine reading scenario.

Diagramatic representation of process

This is all very abstract at the moment but much of it is obvious and the rest I will try to tease out by example in the next post. At the core is the point that process is a complicated thing and different people will want different things from it. This means that it is necessarily going to be a composite object. The log is something that we would always want for any process (but often do not at the moment). The “script”, the instructions to repeat the process, whether it be experimental or analytical is also desirable and should be accessible either by stripping the correct commands out of the log, or by adapting a generic set of instructions for that type of process. The new things is the concept of the graph. This requires two things. Firstly that every relevant object has an identity that can be referenced. Secondly that we capture the context of each object and what we do to it at each stage of the process. It is building systems that capture this as we go that will be the challenge and what I want to try and give an example of in the next post.

The integrated lab record – or the web native lab notebook

At Science Online 09 and at the Smi Electronic Laboratory Notebook meeting in London later in January I talked about how laboratory notebooks might evolve. At Science Online 09 the session was about Open Notebook Science and here I wanted to take the idea of what a “web native” lab record could look like and show that if you go down this road you will get the most out if you are open. At the ELN meeting which was aimed mainly at traditional database backed ELN systems for industry I wanted to show the potential of a web native way of looking at the laboratory record, and in passing to show that these approaches work best when they are open, before beating a retreat back to the position of “but if you’re really paranoid you can implement all of this behind your firewall” so as not to scare them off too much. The talks are quite similar in outline and content and I wanted to work through some of the ideas here.The central premise is one that is similar to that of many web-service start ups: “The traditional paper notebook is to the fully integrated web based lab record as a card index is to Google”. Or to put it another way, if you think in a “web-native” way then you can look to leverage the power of interlinked networks, tagging, social network effects, and other things that don’t exist on a piece of paper, or indeed in most databases. This means stripping back the lab record to basics and re-imagining it as thought it were built around web based functionality.

So what is a lab notebook? At core it is a journal of events, a record of what has happened. Very similar to a Blog in many ways. An episodic record containing dates, times, bits and pieces of often disparate material, cut and pasted into a paper notebook. It is interesting that in fact most people who use online notebooks based on existing services use Wikis rather than blogs. This is for a number of reasons; better user interfaces, sometimes better services and functionality, proper versioning, or just personal preference. But there is one thing that Wikis tend to do very badly that I feel is crucial to thinking about the lab record in a web native way; they generate at best very ropey RSS feeds. Wikis are well suited to report writing and formalising and sharing procedures but they don’t make very good diaries. At the end of the day it ought to possible to do clever things with a single back end database being presented as both blog and wiki but I’ve yet to see anything really impressive in this space so for the moment I am going to stick with the idea of blog as lab notebook because I want to focus on feeds.

So we have the idea of a blog as the record – a minute to minute and day to day record. We will assume we have a wonderful backend and API and a wide range of clients that suit different approaches to writing things down and different situations where this is being done. Witness the plethora of clients for Twittering in every circumstance and mode of interaction for instance. We’ll assume tagging functionality as well as key value pairs that are exposed as microformats and RDF as appropriate. Widgets for ontology look up and autocompleton if it is desired and the ability to automatically generate input forms from any formal description of what an experiment should look like. But above all, this will be exposed in a rich machine readable format in an RSS/Atom feed.What we don’t need is the ability to upload data. Why not? Because we’re thinking web native. On a blog you don’t generally upload images and video directly, you host them on an appropriate service and embed them on the blog page. All of the issues are handled for you and a nice viewer is put in place. The hosting service is optimised for handling the kind of content you need; Flickr for photos, YouTube (Viddler, Bioscreencast) for video, Slideshare for presentations etc. In a properly built ecosystem there would be a data hosting service, ideally one optimised for your type of data, that would provide cut and paste embed codes providing the appropiate visualisations. The lab notebook only needs to point at the data; doesn’t need to know anything much about that data beyond the fact that it is related to the stuff going on around it and that it comes with some html code to embed a visualisation of some sort.

That pointing is the next thing we need to think about. In the way I use the Chemtools LaBLog I use a one post, one item system. This means that every object gets its own post. Each sample, each bottle of material, should have its own post and its own identity. This creates a network of posts that I have written about before. What it also means is that it is possible to apply page rank style algorithms and link analysis more generally in looking at large quantities of posts. Most importantly it encodes the relationship between objects, samples, procedures, data, and analysis in the way the web is tooled up to understand: the relationships are encoded in links. This is a lightweight way of starting to build up a web of data – it doesn’t matter so much to start with whether this is in hardcore RDF as long as there is enough contextual data to make it useful. Some tagging or key-value pairs would be a good start. Most importantly it means that it doesn’t matter at all where our data files are as long as we can point at them with sufficient precision.

But if we’re moving the datafiles off the main record then what about the information about samples? Wouldn’t it be better to use the existing Laboratory Information Management System, or sample management system or database? Well again, as long as you can point at each sample independently with the precision you need then it doesn’t matter. You can use a GoogleSpreadsheet if you want to – you can give URL for each cell, there is a powerful API that would let you build services to make putting the links in easy. We use the LaBLog to keep information on our samples because we have such a wide variety of different materials put to different uses, that the flexibility of using that system rather than a database with a defined schema is important for our way of working. But for other people this may not be the case. It might even be better to use multiple different systems, a database for oligonucleotides, a spreadsheet for environmental samples, and a full blown LIMS for barcoding and following the samples through preparation for sequencing. As long; as it can be pointed at, it can be used. Similar to the data case, it is best to use the system that is best suited to the specific samples. These systems are better developed than they are for data – but many of the existing systems don’t allow a good way of pointing at specific samples from an external document – and very few make it possible to do this via a simple http compliant URL.

So we’ve passed off the data, we’ve passed off the sample management. What we’re left with is the procedures which after all is the core of the record, right? Well no. Procedures are also just documents. Maybe they are text documents, but perhaps they are better expressed as spreadsheets or workflows (or rather the record of running a workflow). Again these may well be better handled by external services, be they word processors, spreadsheets, or specialist services. They just need to be somewhere where we can point at them.

What we are left with is the links themselves, arranged along a timeline. The laboratory record is reduced to a feed which describes the relationships between samples, procedures, and data. This could be a simple feed containing links or a sophisticated and rich XML feed which points out in turn to one or more formal vocabularies to describe the semantic relationship between items. It can all be wired together, some parts less tightly coupled than others, but in principle it can at least be connected. And that takes us one significant step towards wiring up the data web that many of us dream of

The beauty of this approach is that it doesn’t require users to shift from the applications and services that they are already using, like, and understand. What it does require is intelligent and specific repositories for the objects they generate that know enough about the object type to provide useful information and context. What it also requires is good plugins, applications, and services to help people generate the lab record feed. It also requires a minimal and arbitrarily extensible way of describing the relationships. This could be as simple html links with tagging of the objects (once you know an object is a sample and it is linked to a procedure you know a lot about what is going on) but there is a logic in having a minimal vocabulary that describes relationships (what you don’t know explicitly in the tagging version is whether the sample is an input or an output). But it can also be fully semantic if that is what people want. And while the loosely tagged material won’t be easily and tightly coupled to the fully semantic material the connections will at least be there. A combination of both is not perfect, but it’s a step on the way towards the global data graph.

Recording the fiddly bits of experimental and data analysis work

We are in the slow process of gearing up within my group at RAL to adopting the Chemtools LaBLog system and in the process moving properly to an Open Notebook status. This has taken much longer than I had hoped but there have been some interesting lessons along the way. Here I want to think a bit about a problem that has been troubling me for a while.

I haven’t done a very good job of recording what I’ve been doing in the times that I have been in a lab over the past couple of months. Anyone who has been following along will have seen small bursts of apparently unrelated activity where nothing much ever seems to come to a conclusion. This has been divided up mainly into a) a SANS experiment we did in early November which has now moved into a data analysis phase, b) some preliminary, and thus far fairly unconvincing experiments, attempting to use a very new laser tweezers setup at the Central Laser Facility to measure protein-DNA interactions at the single molecule level and c) other random odds and sods that have come by. None of these have been very well recorded for a variety of reasons.

Data analysis, particularly when it uses a variety of specialist software tools, is something I find very challenging to record. A common approach is to take some relatively raw data, run it through some software, and repeat, while fiddling with parameters to get a feel for what is going on. Eventually the analysis is run “for real” and the finalised (at least for the moment) structure/number/graph is generated. The temptation is obviously just to formally record the last step but while this might be ok as a minimum standard if only one person is involved, when more people are working through data sets it makes sense to try and keep track of exactly what has been done and which data has been partially processes in which ways. This helps us both in terms of being able to quickly track where we are with the process but also reduces the risk of replicating effort.

The laser tweezers experiment involves a lot of optimising of buffer conditions, bead loading levels, instrumental parameters and whatnot. Essentially a lot of fiddling, rapid shifts from one thing to another and not always being too sure exactly what is going on. We are still at the stage of getting a feel for things rather than stepping through a well ordered experiment. Again the recording tends to be haphazard as you try on thing  and then another. We’re not even absolutely sure what we should be recording for each “run” or indeed really what a “run” is yet.

The common theme here is “fiddling” and the difficulty of recording it efficiently, accurately, and usefully. What I would prefer to be doing is somehow capturing the important aspects of what we’re doing as we do it. What is less clear is what the best way to do that is. In the case of data analysis we have good model for how to do this well. Good use of repositories and the use of versioned scripts for handling data conversions, in the way the Michael Barton in particular has talked about provide an example of good practice. Unfortunately it is good practice that is almost totally alien to experimental biochemists and is also not easily compatible with a lot of the software we use.

The ideal would be a work bench using a graphical representation of data analysis tools and data repositories that would automatically generate scripts and deposit these and versioned data files into an appropriate repository. This would enable the “docking” of arbitrary web services, software packages and whatever, as well as connection to shared data stores. The purpose of the workbench would be to record what is done, although it might also provide some automation tools. In many ways this is what I think of when look at work flow engines like Taverna and platforms for sharing workflows like MyExperiment.

Its harder in the real world. Here the workbench is, well, the workbench but the idea of recording everything along with contextual metadata is pretty similar. The challenge lies in recording enough different aspects of what is going on to capture the important stuff without generating a huge quantity or data that can never be searched effectively. It is possible to record multiple video streams, audio, screencast any control computers , but it will be almost impossible to find anything in these data streams.

A challenge that emerges over and over again in laboratory recording is that you always seem to not be recording the thing that you really now need to have. Yet if you record everything you still won’t have it because you won’t be able to find it. Video, image, and audio search will one day make a huge difference to this but in the meantime I think we’re just going to keep muddling on.

A use case scenario for Mark…a description of the first experiment on the ISIS LaBLog

Two rather exciting things are happening at the moment. Firstly we have finally got the LaBLog system up and running at RAL (http://biolab.isis.rl.ac.uk). Not a lot is happening there yet but we are gradually working up to a full Open Notebook status, starting by introducing people to the system bit by bit. My first experiment went up there late last week, it isn’t finished yet but I better get some of the data analysis done as rpg, if no-one else, is interested in the results.

The other area of development is that back down in Southampton, Blog MkIII is being specced out and design is going forward. This is being worked on now by both Mark Borkum and Andrew Milsted. Last time I was down in Southampton Mark asked me for some use cases – so I thought I might use the experiment I’ve just recorded to try and explain both the good and bad points of the current system, and also my continuing belief that anything but a very simple data model is likely to be fatally flawed when recording an experiment. This will also hopefully mark the beginning of more actual science content on this blog as I start to describe some of what we are doing and why. As we get more of the record of what we are doing onto the web we will be trying to generate a useful resource for people looking to use our kind of facilities.

So, very briefly the point of the experiment we started last week is to look at the use of GFP as a concentration and scattering standard in Small Angle Scattering. Small angle x-ray and neutron scattering provide an effective way of determining low resolution (say 5-10 A) structures of proteins in solution. However they suffer from serious potential artefacts that must be rigorously excluded before the data analysis can be trusted. One of those most crucial of these is aggregation, whether random conversion of protein into visible crud, or specific protein-protein interactions. Either of these, along with poor background subtraction or any one of a number of other problems can very easily render data and the analysis that depends on it meaningless.

So what to do? Well one approach is to use a very well characterised standard for which concentration, size, and shape are well established. There are plenty of proteins that are well behaved, pretty cheap, and for which the structure is known. However, as any biophysicist will tell you, measuring protein concentration accurately and precisely is tough; colorimetric assays are next to useless and measuring the UV absorbance of aromatic residues is pretty insensitive, prone to interference with other biological molecules (particularly DNA), and a lot harder to do right than most people think.

Our approach is to look at whether GFP is a good potential standard (specifically an eGFP engineered to prevent the tetramerisation that is common with the natural proteins). It has a strong absoprtion, well clear of most other biological molecules at 490 nm, it is dead easy to produce in large quantities (in our hands, I know other people have had trouble with this but we routinely pump out hundreds of milligrams and currently have a little over one gramme in the freezer), is stable in solution at high concentrations and freeze dries nicely. Sounds great! In principle we can do our scattering, then take the same sample cells, put them directly in a spectrophotometer, and measure the concentration. Last week was about doing some initial tests on a lab SAXS instrument to see whether the concept held up.

So – to our use case.

Maria, a student from Southampton, met me in Bath holding samples of GFP made up to 1, 2, 5, and 10 mg/mL in buffer. I quizzed Maria as to exactly how the samples had been made up and then recorded that in the LaBLog (post here). I then created the four posts representing each of the samples (1, 2, 3, 4). I also created a template for doing SAXS, and then, using that template I started filling in the first couple of planned samples (but I didn’t actually submit the post until sometime later).

At this point, as the buffer background was running, I realised that the 10mg/mL sample actually had visible aggregate in it. As the 5 mg/mL sample didn’t have any aggregate we changed the planned order of SAXS samples, starting with the 5 mg/mL sample. At the same time, we centrifuged the 10 mg/mL sample, which appeared to work quite nicely, generating a new, cleared 10 mg/mL sample, and prepared fresh 5 mg/mL and fresh 2 mg/mL samples.

Due to a lack of confidence in how we had got the image plate into its reader we actually ended up running the original 5 mg/mL sample three times. The second time we really did muck up the transfer but comparisons of the first and third time made us confident the first one was ok. At this point we were late for lunch and decided we would put the lowest concentration (1 mg/mL) sample on for an hour and grab something to eat. Note that by this time we had changed the expected order of samples about three or four times but none of this is actually recorded because I didn’t actually commit the record of data collection until the end of the day.

By this stage the running of samples was humming along quite nicely. It was time to deal with the data. The raw data comes off the instrument in the form of an image. I haven’t actually got these off the original computer as yet because they are rather large. However they are then immediately processed into relatively small two column data. It seems clear that each data file requires its own identity so those were all created (using another template) . Currently, several of these do not even have the two column text data, the big tiff files broke the system on upload, and I got fed up with uploading the reduced data by hand into each file.

As a result of running out of time and the patience to upload multiple files, the description of the data reduction is a bit terse, and although there are links to all the data most of you will get a 404 if you try to follow them, so I need to bring all of that back down and put it into the LaBLog proper where it is accessible but if you look closely here, you will see I made a mistake with some of the data analysis that needs fixing. I’m not sure I can be bothered systematically uploading all the incorrect files. If the system were acting naturally as a file repository and I was acting directly on those files then it would be part of the main workflow that everything would be made available automatically. The problem here was that I was forced by the instrument software to do the analysis on a specific computer (that wasn’t networked) and that our LaBLog system has no means of multiple file upload.

So to summarise the use case.

  1. Maria created four samples
  2. Original plan created to run the four samples plus backgrounds
  3. Realised 10mg/mL sample was aggregating and centrifuged to clear it (new unexpected procedure)
  4. Ran one of the pre-made samples three times, first time wasn’t confident, second time was a failure, third time confirmed first time was ok
  5. New samples prepared from cleared 10 mg/mL sample
  6. Prepared two new samples from cleared 10 mg/mL sample
  7. Re-worked plan for running samples based on time available
  8. Ran 1 mg/mL sample for different amount of time than previous samples
  9. Ran remaining samples for various amounts of time
  10. Data was collected from each sample after it was run and converted to a two column text format
  11. Two column data was rebinned and background subtracted (this is where I went wrong with some of them, forgetting that in some cases I had two lots of electronic background)
  12. Subtracted data was rebinned again and then desmeared (the instrument has a slit geometry rather than a pinhole) to generate a new two column data file.

So, four original samples, and three unexpected ones were created. One set of data collection led to nine raw data files which were then recombined in a range of different ways depending on collection times. Ultimately this generates four finalised reduced datasets, plus a number of files along the way. Two people were involved. And all of this was done under reasonable time pressure. If you look at the commit times on the posts you will realise that a lot of these were written (or at least submitted) rather late in the day, particularly the data analysis. This is because the data analysis was offline, out of the notebook in proprietary software. Not a lot that can be done about this. The other things that were late were the posts associated with the ‘raw’ datafiles. In both cases a major help would be a ‘directory watcher’ that automatically uploads files and queues them up somewhere so they are available to link to.

This was not an overly complicated or unusual experiment but one that illustrates the pretty common  changes of direction mid-stream and reassessments of priorities as we went. What it does demonstrate is the essential messiness of the process. There is no single workflow that traces through the experiment that can be applied across the whole experiment, either in the practical or the data analysis parts. There is no straightforward parallel process applied to a single set of samples but multiple, related samples, that require slightly different tacks to be taken with data analysis.  What there are, are objects that have relationships. The critical thing in any laboratory recording system is making the recording of both the objects, and the relationships between them, as simple and as natural as possible. Anything else and the record simply won’t get made.

The distinction between recording and presenting – and what it means for an online lab notebook

Something that has been bothering me for quite some time fell into place for me in the last few weeks. I had always been slightly confused by my reaction to the fact that on UsefulChem Jean-Claude actively works to improve and polish the description of the experiments on the wiki. Indeed this is one of the reasons he uses a wiki as the process of making modifications to posts on blogs is generally less convenient and in most cases there isn’t a robust record of the different versions. I have always felt uncomfortable about this because to me a lab book is about the record of what happened – including any mistakes in recording you make along the way. There is some more nebulous object (probably called a report) which aggregates and polishes the description of the experiments together.

Now this is fine, but point is that the full history of a UsefulChem page is immediately available from the history. So the full record is very clearly there – it is just not what is displayed. In our system we tend to capture a warts and all view of what was recorded at the time and only correct typos or append comments or observations to a post. This tends not be very human readable in most cases – to understand the point of what is going on you have to step above this to a higher level – one which we are arguably not very good at describing at the moment.

I had thought for a long time that this was a difference between our respective fields. The synthetic chemistry of UsefulChem lends itself to a slightly higher level description where the process of a chemical reaction is described in a fairly well defined, community accepted, style. Our biochemistry is more a set of multistep processes where each of those steps is quite stereotyped. In fact for us it is difficult to define where the ‘experiment’ begins and end. This is at least partly true, but actually if you delve a little deeper and also have a look at Jean-Claude’s recent efforts to use a controlled vocabulary to describe the synthetic procedures a different view arises. Each line of one these ‘machine readable’ descriptions actually maps very well onto each of our posts in the LaBLog. Something that maps on even better is the log that appears near the bottom of each UsefulChem page. What we are actually recording is rather similar. It is simply that Jean-Claude is presenting it at a different level of abstraction.

And that I think is the key. It is true that synthetic chemistry lends itself to a slightly different level of abstraction than biochemistry and molecular biology, but the key difference actually comes in motivation. Jean-Claude’s motivation from the beginning has been to make the research record fully available to other scientists; to present that information to potential users. My focus has always been on recording the process that occurs in the lab and particular to capture the connections between objects and data files. Hence we have adopted a fine grained approach that provides a good record, but does not necessarily make it easy for someone to follow the process through. On UsefulChem the ideal final product contains a clear description of how to repeat the experiment. On the LaBLog this will require tracking through several posts to pick up the thread.

This also plays into the discussion I had some months ago with Frank Gibson about the use of data models. There is a lot to be said for using a data model to present the description of an experiment. It provides all sorts of added value to have an agreed model of what these descriptions look like. However it is less clear to me that it provides a useful way of recording or capturing the research process as it happen, at least in a general case. Stream of consciousness recording of what has happened, rather than stopping halfway through to figure out how what you are doing fits into the data model, is what is required at the recording stage. One of the reasons people feel uncomfortable with electronic lab notebooks is that they feel they will lose the ability to scribble such ‘free form’ notes – the lack of any presuppositions about what the page should loook like is one of the strengths of pen and paper.

However, once the record, or records, have been made then it is appropriate to pull these together and make sense of them – to present the description of an experiment in a structured and sensible fashion. This can of course be linked back to the primary records and specific data files but it provides a comprehensible and fine grained descriptionof the rationale for and conduct of the experiment as well as placing the results in context. This ‘presentation layer’ is something that is missing from our LaBLog but could relatively easily be pulled together by writing up the methodology section for a report. This would be good for us and good for people coming into the system looking for specific information.

Person Frank Gibson

Right click for SmartMenu shortcuts

The trouble with semantics…

…is knowing what you mean…

I posted last week about the spontaneous CMLReact hackfest held around Peter Murray-Rust’s dining room table the day after Science Blogging in London. There were a number of interesting things that came out of the exercise for me. The first was that it would be relatively easy to design a moderately strict, but pretty standard, description format for a synthetic chemistry lab notebook that could be automatically scraped into CMLReact.

Automatic conversions from lab book to machine readable XML

CMLReact files have (roughly) three sections. In the first, all the molecules that are relevant to the description are described, or in the ideal semantic web world pointed to at an external authority such as Chemspider, PubChem, or other source. In the second section the relationships between input materials, solvents, products, and samples are described. In general all of these will be molecules which are referred to in the first session but this is not absolutely required (and this will be important later). The final section describes observables, procedures, yields, and other descriptions of what happened or what was measured.

If we take a look at the UsefulChem experiment that we converted to CMLReact you can see that most of this information is available in one form or another. The molecules are described via InChi/InChiKey at the bottom of the page. This could be used as they are to populate the molecules section. A little additional markup to distinguish between reactants, solvents, reagents, and products would make it possible to start populating the second section describing the relationships between these molecules.

The third section is the most tricky, and this will always be an 80:20 game. The object is to abstract as much information as can be reasonably garnered without putting in the vast amount of work required to get close to 100% retrieval. At the end of the day, if someone wants the real detail they can go back to the lab book. Peter has demonstrated text scraping tools that do a pretty good job of extracting a lot of this information. In combination with a bit of markup it is reasonable to expect that some basic information (amounts of reagents, yield, temperature of reaction, some descriptive terms) could reasonably be extracted. Again, getting 80-90% of a subset of regularly used terms  would be very powerful.

But what are we describing?

There is a problem with grabbing this descriptive information from the lab notebook however, and it is a problem that is very general and something I believe we need to grapple with urgently. There is a fundamental question as to what it is that this file is describing. Does it describe the plan of the experiment? The record of carrying out a specific example of this experiment? An ‘averaged’ description of a set of equivalent experiments? A general description of the reaction? Or a description of a model of what we expect or think is happening?

If you look closely at the current version of the CMLReact file you will see that the yield is expressed as a percentage with a standard deviation. This is actually describing the average of three independent reactions but that is not actually made explicit anywhere in this file. Is this important? Well I think it is because it has an effect on what any outward links back to the lab book mean. There is a significant difference between – ‘this link points to an example of this kind of reaction’ (which might in fact be significantly different in the details) and ‘this link points to this exact experiment’ or indeed ‘this link points to an index of relevant experimental results’. Those distinctions need to be encoded in the links, or perhaps more likely made explicit in the abstracted file.

The CMLReact file is an abstraction of the experimental record. It is therefore important to make it clear what the level of abtraction is and what has been abstracted out of that description. This relates to the distinction I have made before between the flexibility required to record an experiment versus the ability to use a more structured vocabulary to describe the experiment after it has happened. My impression is that people who work in developing these controlled vocabularies are focussed on description rather than recording and don’t often make the distinction between the two. There is also often a lack of distinction between describing an experiment and describing a model of what happened in that experiment.  This is important because the model may need to be modified in the future whereas the description of the experiment should be accurate.

Summary

My view remains that when recording an experiment the system used should be as flexible as possible. Structure can be added to this primary record when convenient to make the process of abstracting from this primary record to a controlled vocabulary easier. The primary goal for me, for the moment, remains making a human readable record available. The process of converting the primary record into a controlled vocabulary, such as CMLReact, FuGE, or workflow system such as Taverna, should be enabled via domain specific automated or semi-automated tools that help the user to structure their description of the experiment in a way that makes it more directly useful to them but maintains the links with the primary record. Where the same controlled vocabulary is used for more abstracted descriptions of studies, experiments, or the models that purport to describe them, this distinction must be made clear.

Semantics depends absolutely on being clear about what you are describing. There is absolutely no point in having absolute clarity about the description of an object if the nature of that object is fuzzy. Get it right and we could have a very sophisticated description of the scientific record. Get it wrong and that description could be at best unclear and at worst downright misleading.

Southampton Open Science Workshop 31 August and 1 September

An update on the Workshop that I announced previously. We have a number of people confirmed to come down and I need to start firming up numbers. I will be emailing a few people over the weekend so sorry if you get this via more than one route. The plan of attack remains as follows:

Meet on evening of Sunday 31 August in Southampton, most likely at a bar/restaurant near the University to coordinate/organise the details of sessions.

Commence on Monday at ~9:30 and finish around 4:30pm (with the option of discussion going into the evening) with three or four sessions over the course of the day broadly divided into the areas of tools, social issues, and policy. We have people interested and expert in all of these areas coming so we should be able to to have a good discussion. The object is to keep it very informal but to keep the discussion productive. Numbers are likely to be around 15-20 people. For those not lucky enough to be in the area we will aim to record and stream the sessions, probably using a combination of dimdim, mogulus, and slideshare. Some of these may require you to be signed into our session so if you are interested drop me a line at the account below.

To register for the meeting please send me an email to my gmail account (cameronneylon). To avoid any potential confusion, even if you have emailed me in the past week or so about this please email again so that I have a comprehensive list in one place. I will get back to you with a request via PayPal for £15 to cover coffees and lunch for the day (so if you have a PayPal account you want to use please send the email from that address). If there is a problem with the cost please state so in your email and we will see what we can do. We can suggest options for accomodation but will ask you to sort it out for yourself.

I have set up a wiki to discuss the workshop which is currently completely open access. If I see spam or hacking problems I will close it down to members only (so it would be helpful if you could create an account) but hopefully it might last a few weeks in the open form. Please add your name and any relevant details you are happy to give out to the Attendees page and add any presentations or demos you would be interested in giving, or would be interested in hearing about, on the Programme suggestion page.