I’ve spent a long time talking about two things that our LaBLog enables, or rather that it should enable. One is that by changing the way we view the record we can look at our results and materials in a new way. The second is that we want to enable a machine to read the lab book. Andrew Milsted, the main developer of the LaBLog and a PhD student in Jeremy Frey’s group, has just enabled a significant step in that direction. He’s managed to dump my lab book as rdf which enables us to look at it in an rdf viewer such as Welkin, developed by the Simile group at MIT.
At the moment this just shows each post as a node and the links between posts as edges. But there a number of th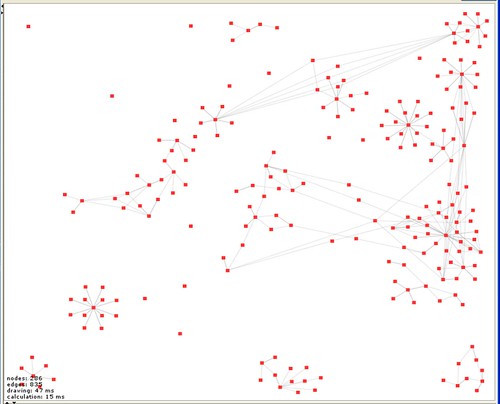 ings that are immediately obvious. The first is that I start a lot of things and don’t necessarily manage to get very far with them and that I do a number of (currently) unrelated things (isolated subgraphs aren’t connected). Also that there are some materials that get widely re-used and some that don’t. There are also clearly things that I haven’t finished entering properly (isolated nodes). Finally, that we need a more sophisticated tool for playing with the view because building a human readable version of the graph will require some manipulation, grabbing subgraphs and moving them around. Welkin is great but after 30 minutes playing I have a bunch of feature requests. But this is what I’ve done so far. I am sure there are many things that can be done with this kind of view – but for the moment what is important is that it is an entirely new kind of way of looking at the record.
For those interested in following progress on another story, the data and analysis built on the model that Pawel Szczesny built for us is in the bottom right hand corner of the graph. You can see thatat the moment it is isolated from the rest of the graph because we haven’t yet compared these models with our experimental results (actually the relevant experiments aren’t on this graph because it was dumped before we did them). That’s something we should be doing in the next few days. If the data matches the model (current indications are that it does, but data quality is an issue) then we will have something very interesting to say about the structural changes on ligand binding in ligand gated ion channels.
Just out of curiosity how different is this from Cytoscape ?
Just out of curiosity how different is this from Cytoscape ?
In terms of viewers Welkin was just what I had to hand. I hadn’t really looked in cytoscape before in detail but now I have some data I probably ought to look at it in detail. But I can’t see anywhere on the website whether it accepts arbitrary RDF as a data format? Search for rdf on the wiki comes up with no results.
However the point is not that the visualisation of networks is new or that that you couldn’t look at data this way before but that I can look at my lab book this way (and indeed integrate it with someone else’s in principle). This is not data from my lab book – it is the lab book itself – so what we can do with this new way of visualising it is an interesting think to explore.
I’m Welkin’s original author and I would be very interested in hearing about your feature requests.
I’m Welkin’s original author and I would be very interested in hearing about your feature requests.
If you have a small amount of RDF, you might want to try RDF Gravity (http://semweb.salzburgresearch.at/apps/rdf-gravity/) for a more interesting user experience or, better yet, forget directly viewing the graphs and make an Exhibit (now at http://code.google.com/p/simile-widgets/) out of the data.
If you have a small amount of RDF, you might want to try RDF Gravity (http://semweb.salzburgresearch.at/apps/rdf-gravity/) for a more interesting user experience or, better yet, forget directly viewing the graphs and make an Exhibit (now at http://code.google.com/p/simile-widgets/) out of the data.
Stefano, thanks for dropping by. Most of my immediate suggestions relate to ways of user reformatting the graph a bit so as to prepare a nice picture. First request: be able to save the state of the picture :) But other things would be to be able to freeze and drag collections of nodes. I spent a bit of time pulling on nodes to try and tease apart the network but often seemed to be serially moving sets of nodes around. If I could drag a lasso around a set or ‘shift click’ than that would be great. Similar to this the ability to just focus on one subgraph would be helpful (although strictly I should probably just generate the separate graphs).
I think my main perception is being driven by the wish to prepare pictures to show people rather than explore the graph. So I am wanting to impose my own percetion on how the graph should be ordered.
David, thanks for the tips, I will certainly have a look. We can make an exhibit but that almost takes us back, in terms of functionality, to the blog format we start with. Although with Exhibit it would be more manipulatable perhaps. But I will have to check out the gadgets.
Either we we need to get more of the background data from the posts into the rdf file before we can start doing really fun stuff.
There are similar characteristics in whole body of science.
http://www.mapofscience.com/
http://informationesthetics.org/node/20
There are similar characteristics in whole body of science.
http://www.mapofscience.com/
http://informationesthetics.org/node/20
@Cameron Neylon: Maybe the URL mentioned below could answer your question about compatibilty with arbitrary RDF data.
http://www.mkbergman.com/?p=415
I have toyed with Cytoscape a little bit. Will definitely take a look at Welkin, though I dont have much data to play with at the moment.
@Cameron Neylon: Maybe the URL mentioned below could answer your question about compatibilty with arbitrary RDF data.
http://www.mkbergman.com/?p=415
I have toyed with Cytoscape a little bit. Will definitely take a look at Welkin, though I dont have much data to play with at the moment.
Roozbeh, thanks for those links, they are rather cool. One thing I would emphasise is that I didn’t mean to suggest that this was a new way of looking at data or even the relationships between data. That’s what rdf/xml and graph analysis is for. The key point is that I don’t believe anyone has looked at a lab book this way before. The other point to make is that our lab book has no explicit data model, yet we can pull something like this together and it makes sense.
As Deepak Singh pointed out the real value here is that we can now conceive of linking the lab book into the dataweb examples that you linked to – and that is very exciting.
Chirag – cheers for the link. Will have a look then. I just couldn’t find any info from a brief play with the cytoscape site. Will download and look at it on the plane next week. Welkin is a great lightweight tool for exploring the network but I don’t think its really built with preparing visualisations in mind. Stefano may have a comment on that?
Chirag – cheers for the link. Will have a look then. I just couldn’t find any info from a brief play with the cytoscape site. Will download and look at it on the plane next week. Welkin is a great lightweight tool for exploring the network but I don’t think its really built with preparing visualisations in mind. Stefano may have a comment on that?
surely. I meant we can see the lab. notebook of the world! (IT IS NOT TOO OPEN!) too.
surely. I meant we can see the lab. notebook of the world! (IT IS NOT TOO OPEN!) too.
Roozbeh, absolutely, and if we can link it together we can do STUFF! I’m not sure exactly what stuff right at the moment but I am sure that clever things could be done.
Roozbeh, absolutely, and if we can link it together we can do STUFF! I’m not sure exactly what stuff right at the moment but I am sure that clever things could be done.
I started blogging an ‘uncourse’ and then mining the linkback structure to see the different emergent narrative threads that arose in the blog over time: eg http://ouseful.open.ac.uk/blogarchive/014839.html and http://ouseful.open.ac.uk/blogarchive/014840.html
I started blogging an ‘uncourse’ and then mining the linkback structure to see the different emergent narrative threads that arose in the blog over time: eg http://ouseful.open.ac.uk/blogarchive/014839.html and http://ouseful.open.ac.uk/blogarchive/014840.html